Tatari Gives Marketers Powerful Tools for Granular TV Campaign Analysis
Tatari is constantly developing new features for marketers to perform deep analysis of TV ad performance, giving TV advertising a more “digital-like” experience. We give advertisers tools so they can better understand performance and where to optimize, as well as easily compare results across their marketing portfolio.
Over the past six months, we’ve rolled out several new features to our platform that enable faster, more intuitive, and more in-depth analysis of TV campaigns.
In addition to viewing performance charts in the Tatari dashboard, advertisers can analyze performance at a more granular level through a:
CPA Report: a detailed report of campaign performance
Creative Heatmap: a visualized analysis of creative performance
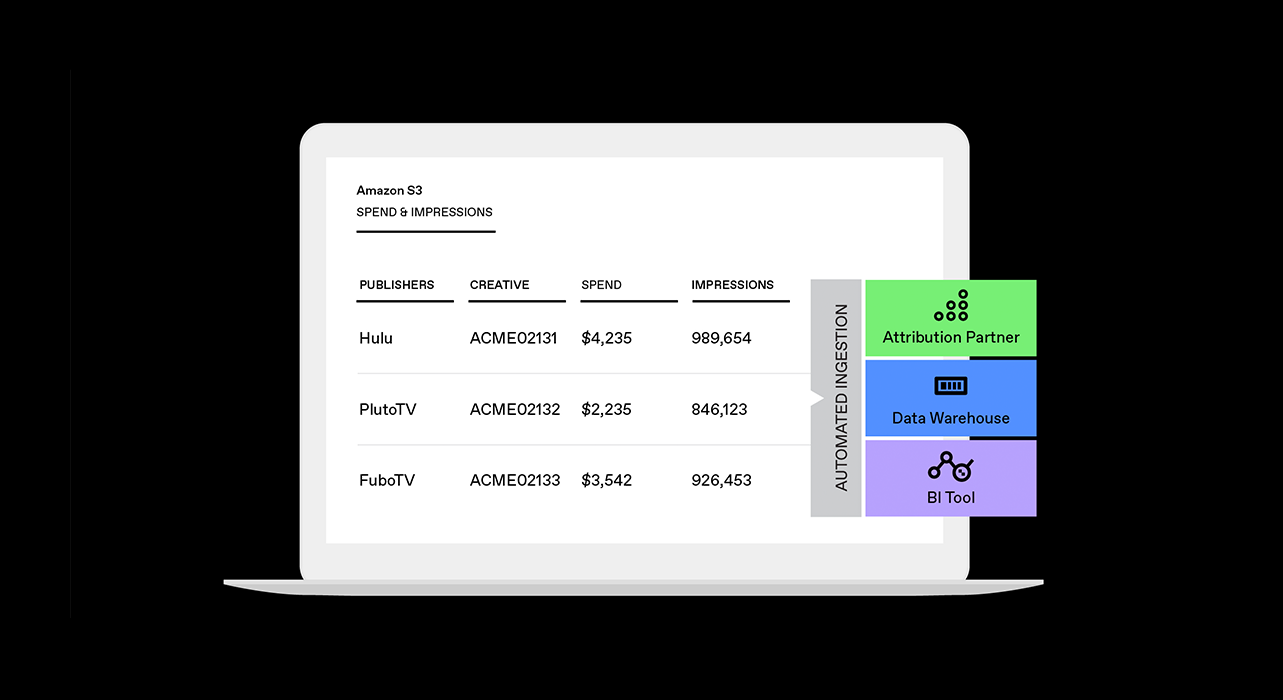
Fast and secure data access into internal tools and for attribution partners: marketers can automatically ingest data from Tatari’s S3 buckets into their internal tools or multi-touch attribution partners for further analysis (Blog)
Together, these new features help marketers measure TV campaigns with the sophistication and detail of a digital campaign, and make it easier to compare one against the other.
Comprehensive Reporting From Tatari’s Dashboard
Tatari has created reporting to deliver a detailed and granular view of TV performance in an elegant and shareable format. In a single table, marketers can filter comprehensive campaign data by specific publishers, creatives, or spend thresholds, compare view-through and incremental response side by side, and analyze campaigns based on key performance metrics (CPA, CPI, CPV, lift, and others). The CPA Report also records performance data going back to marketers’ first campaign, providing a comprehensive dataset for spotting trends.
This offers advertisers granular data so they can answer their specific campaign questions.
How did our creatives perform on a specific network or publisher?
What was our CPV, CPA, CPI, or lift by network or publisher and/or week?
What is our daily spend by network or publisher, week, and/or creative?
How much did we spend this year and what trends are we finding?
Creative Heatmap
One reason that TV has retained its marketing power is that it still presents an opportunity to engage consumers with captivating creative on a big screen in a lean-forward viewing environment. Brands invest heavily in their ad creative because it can become the dominant thing that consumers think of, for years or decades to come.
Tatari’s Creative Heatmap is designed to bring digital-style creative analytics and optimization to TV campaigns. The feature allows marketers to see which creative assets perform well on which networks.
It can help them answer questions such as:
Which of my creatives perform the best (or worst) on a particular network?
How are my creatives performing week over week, or over time?
Do my creatives perform well on one network, but poorly overall?
What trends are we finding across networks or different times throughout the year?
How should I optimize my creative mix to improve my CPx?
Facilitating further attribution and analysis through Tatari's S3 bucket
Tatari S3 buckets allow marketers to securely access granular TV response data to inform further analysis. S3 is a cloud file-sharing service where clients can ingest data automatically into their chosen multi-touch attribution vendor (like Rockerbox), data warehouse or internal tools, similar to an API. Tatari is the first and only company to allow brands to access TV performance data via S3 buckets.
Tatari clients can automatically ingest raw data and thus enable even deeper client-side analysis using their preferred methodology. Files available via this process today:
Streaming: Spend, impressions, user attribution, and publisher-level metrics
Linear TV: Spend, impressions, and spot-level metrics
Within streaming, the availability of user-level attribution completes a closed-loop analysis and enables advertisers to understand the actions users took as a result of seeing your TV ad. With it they’ll be able to:
Complete deeper analysis across all digital advertising channels to see the full customer journey.
Construct LTV cohorts (i.e. understand who comes from TV and how much they’ll spend over a certain timeframe).
Tatari is fortunate to work with sophisticated performance advertisers that apply the best available tools to their craft. Tatari S3 Buckets are designed to empower each client to add new layers of analysis to improve campaign performance and drive business outcomes.
Tatari’s product roadmap is focused on features like these that continue to make TV more like digital mediums - more agile, more transparent, and more accountable to outcomes.

Courtney Minson
I work on product marketing and I've never had coffee.
Related
Why Amazon is the Missing Piece of the TV Measurement Puzzle
For brands advertising on TV and selling on Amazon, see how integrating Amazon sales figures into your analysis unlocks a holistic view of your true ROI.
Read more
TV Can No Longer Be Overlooked in Media Plans for 2026
TV budgets are rising in 2026—but not for the reasons you might expect. New advertiser data shows how TV is being redefined as a performance channel that strengthens search, social, and full-funnel results.
Read more
Why Sports Is The Fastest Way To Break CTV’s Programmatic Ceiling
Programmatic buying dominates CTV, but it rarely delivers true scale. Here’s why sports-focused direct buying is the game plan brands are using to unlock reach, context, and measurable impact—without blowing budgets.
Read more


